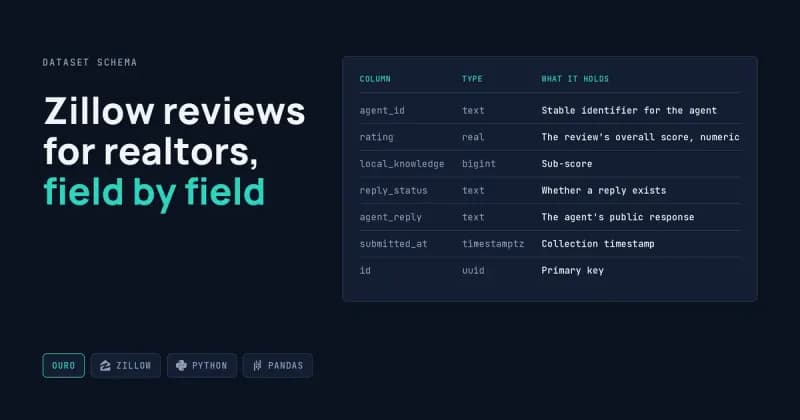
You want to know what clients actually say about real estate agents: which words show up in five-star reviews, how often agents reply, how one agent compares to the pack. Collecting that yourself takes weeks. I published a Zillow reviews for realtors dataset on Ouro, and it carries one row per review across 26 columns. This article walks through every column, what each one is good for, and the three fields most likely to hand you a wrong answer if you use them carelessly.
What's Inside the Zillow Reviews for Realtors Dataset
The grain is one row per review, not one row per agent. That single fact decides how you query it: agent-level figures like average rating and total review count are repeated on every row belonging to that agent, so summing them gives nonsense.
The dataset page on Ouro with the full column schema lists 26 data columns plus a uuid primary key called id. Real estate agent review data usually arrives as two loose columns, a rating and a comment. This one keeps the sub-scores, the agent's public reply, and the provenance of where each row came from.
The Column Map, Group by Group
The 26 agent ratings dataset columns fall into four groups: who the agent is, how they were scored, what was written, and where the row came from. Reading them in groups is faster than reading them alphabetically.
Group 1 — Agent identity
Column | Type | What it holds |
|---|---|---|
| text | Stable identifier for the agent |
| text | Display name on the profile |
| text | Market the agent lists under |
| text | Firm the agent is attached to |
| real | The agent's profile-level average |
| bigint | Total reviews on that profile |
Group your analysis on agent_id rather than agent_name. Two agents can share a name, and a name can change spelling between collection runs.
Group 2 — The rating columns
Column | Type | What it holds |
|---|---|---|
| real | The review's overall score, numeric |
| text | The same score as it appeared on the page |
| bigint | Sub-score |
| bigint | Sub-score |
| bigint | Sub-score |
| bigint | Sub-score |
| real | This review measured against the agent's own average |
rating is your numeric field and stars is the text version of it. Averaging a text column either fails outright or silently coerces, so always aggregate on rating.
Group 3 — The written content
Column | Type | What it holds |
|---|---|---|
| text | The client's written review |
| text | The deal context, such as a purchase or a sale |
| text | Reviewer identifier |
| text | Public handle shown on the review |
| text | The agent's public response |
| text | Whether a reply exists |
| date | Date of the review, already typed as a date |
reply_status is the column that saves you work. Filtering on a short text flag is far cheaper than testing whether agent_reply is empty, blank, or whitespace.
Group 4 — Provenance
Column | Type | What it holds |
|---|---|---|
| text | Identifier for the individual review |
| bigint | Review sequence on the profile |
| bigint | Where the review sat in the list |
| bigint | Which page of the profile it came from |
| text | Where the row originated |
| timestamptz | Collection timestamp |
| uuid | Primary key |
Most people skip this group. They shouldn't. page_number and position let you check that pagination captured everything rather than looping on page one, and submitted_at tells you how old any given row is.
Five Questions This Schema Answers Straight Away
Because the sub-scores are kept as separate numeric columns, review sentiment analysis stops being a text-mining project and becomes a set of aggregates. Ouro's Python client takes read-only SQL with {{table}} standing in for the table name.
Which service dimension drags ratings down?
SELECT AVG(local_knowledge)    AS knowledge,
       AVG(process_expertise)  AS process,
       AVG(responsiveness)     AS responsive,
       AVG(negotiation_skills) AS negotiation
FROM {{table}};
How many agents reply to reviews at all?
SELECT reply_status, COUNT(*) AS reviews
FROM {{table}}
GROUP BY reply_status
ORDER BY reviews DESC;
Which brokerages carry the strongest ratings?
Group on brokerage and average rating, then filter out brokerages below a sensible row count so a single agent with four reviews doesn't top the table.
What does an unusually bad review look like?
Sort ascending on vs_agent_avg to surface reviews that sit furthest below the agent's own norm. Those are the ones worth reading in full.
Are ratings moving over time?
review_date is already a proper date type, so a monthly rollup is one DATE_TRUNC away with no parsing.
Where This Data Will Trip You Up
Every review dataset has soft spots, and honest zillow data cleaning means naming them before you build a chart on top. Here are the ones in this schema.
Sub-scores are optional on Zillow. local_knowledge, process_expertise, responsiveness and negotiation_skills are not filled in on every review, particularly older ones. Averaging across the whole table without excluding nulls compares different sample sizes in each column. Count non-null rows per sub-score before you compare them.
Agent-level columns repeat. agent_avg_rating and agent_review_count describe the agent, not the review, so they appear once per row. Any SUM() on them is meaningless, and even AVG() is weighted by how many reviews each agent has. Collapse to one row per agent_id first.
stars and rating can diverge. One is text as displayed, one is numeric. If a page ever renders a half-star or a non-standard label, the text field keeps it and the numeric field rounds or drops it. Spot-check a sample where the two disagree before trusting either at scale.
vs_agent_avg has a sign convention. Check on a few known rows whether positive means above or below the agent's average. Charting it backwards is an easy mistake and an embarrassing one.
Reviewer identity is two columns. reviewer and screen_name both exist because Zillow does not always show a consistent handle. Deduplicating on one alone can merge two different people or split one. I dedupe on review_id where it is present and fall back to reviewer plus review_date plus the opening of review_comment.
Text fields carry line breaks and quotes. review_comment and agent_reply are free text, so exporting to CSV without proper quoting splits rows apart. Read it as Parquet or a DataFrame where you can, and if you must have CSV, open it as UTF-8 with quoted fields. The Pandas read_csv reference on encoding and quoting covers the arguments involved.
It is a snapshot, not a feed. submitted_at marks when each row was collected. Agents keep accumulating reviews and occasionally switch brokerage, so treat brokerage and review counts as true at collection time.
If You Need Rows This File Doesn't Have
The dataset covers a fixed set of agents. If your list is specific, say every agent in three counties, or you need it refreshed monthly, that is a build rather than a download. It is the same 26-column shape, pointed at your URLs and delivered on a schedule to Google Sheets, Airtable or PostgreSQL. My scheduled scraping and delivery services page covers how those runs are set up.
Frequently Asked Questions
What is the row grain of this dataset?
One row is one review. Agent details such as name, brokerage, average rating and total review count repeat across every review belonging to that agent. Before producing any agent-level statistic, collapse to distinct agent_id rows, otherwise agents with many reviews dominate the result.
Can I use Zillow reviews for realtors data commercially?
I build the technical side and I am not a lawyer. Zillow's terms of use for its site and content set out what the platform permits, and how that applies to your specific use is a decision for you and your counsel, not something I can rule on.
Why are there both rating and stars columns?
rating is stored as a numeric type for maths, while stars preserves the value as it appeared on the page. Keeping both means a rendering quirk never silently destroys the original. Aggregate on rating; consult stars when a number looks wrong.
How do I query it without downloading everything?
Ouro's Python client accepts read-only SQL with {{table}} as a placeholder, so you can run a grouped aggregate server-side and pull back a few dozen rows rather than the whole table. That keeps exploratory work fast and avoids handling the full text columns locally.
Is the sub-score data complete?
No, and you should not assume it is. Zillow's sub-scores are optional, so expect nulls concentrated in older reviews. Always count non-null rows per column alongside the average, and state that count wherever you present the figure to someone else.
For a problem like this I'd build a scraper that produces this exact 26-column shape against your own agent list, deduplicated, dated, and written to your database or Sheet on a schedule. Send me your agent list and I'll scope the extraction.
More on schema design and CSV cleanup sits in the DatafetchPro article archive, and how I work as a one-person shop explains what a typical build and handover looks like.